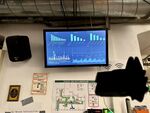
Dashboard
| Language: | English |
|---|
| Dashboard | |

| |
| Gestartet: | |
| Involvierte: | anlumo |
| Status: | in progress |
| Beschreibung: | It's a display showing interesting statistics. |
| Shutdownprozedur: | Integrated into SmartLab |
| Zuletzt aktualisiert: | 2025-01-04 |
The Dashboard is an art installation in the Otter Space between the server room and the kitchen passage. It currently displays a few interesting stats about the Metalab, mostly concerning the drink sales.
It is currently just a Raspberry Pi 3 running FullPageOS. Its web browser opens a Grafana public dashboard hosted on the SmartLab server.
Version 2
Version 1 is ok, but it has several shortcomings stemming from the fact that Grafana not being designed for this kind of use case (public dashboards). Other solutions should be evaluated.
| Requirement | Grafana | Home Assistant | Flutter | info-beamer |
|---|---|---|---|---|
| Hosted locally | ✔ | ✔ | ✔ | ✔ |
| Starts on a Raspberry Pi without user interaction | alpha state | ✘ | ✔ | ✔ |
| Basic bar charts | ✔ | ✘ | ✔ | ?/custom |
| Multi-series bar charts | ✔ | ✘ | ✔ | ?/custom |
| Basic line charts | ✔ | ✔ | ✔ | ?/custom via HTML |
| Moving average line charts | ✔ | ✘ | ✔ | ?/custom via HTML |
| Cropping outliers from charts | ✘ | ✘ | ✔ | ?/custom via HTML |
| Free color choice | ✘ | ✘ | ✔ | ?/custom via HTML |
| Displaying binary live data | ✘ | ✔ | ✔ | ?/custom via HTML |
| Displaying live text messages | ✘ | ✔ | ✔ | ?/custom via HTML |
| Autoswitching between multiple screens | ✘ | ✘ | ✔ | ✔ |
The Flutter solution is the most work, because it requires software development rather than just configuration. The idea is to use Charts Painter to write a regular Flutter application that then uses flutter-pi to run on the device (automatically after boot).
Another option for a custom application would be Dash which does the same thing in Python.
anlumo invites everybody else to evaluate other solutions and append another column on the table above!
Noteworthy Wiki Pages
- In the past, there was the Teletext project, which seems to have served a similar purpose.
