Dashboard: Unterschied zwischen den Versionen
Anlumo (Diskussion | Beiträge) K |
Pete (Diskussion | Beiträge) |
||
| (5 dazwischenliegende Versionen von einem anderen Benutzer werden nicht angezeigt) | |||
| Zeile 2: | Zeile 2: | ||
{{Projekt | {{Projekt | ||
| − | |image= | + | |image=Dashboard.jpeg |
|involved=[[User:anlumo|anlumo]] | |involved=[[User:anlumo|anlumo]] | ||
|status=in progress | |status=in progress | ||
| Zeile 20: | Zeile 20: | ||
|+ Requirements Table | |+ Requirements Table | ||
|- | |- | ||
| − | !Requirement !! Grafana !! Home Assistant !! Flutter | + | !Requirement !! Grafana !! Home Assistant !! Flutter !! [https://info-beamer.com/ info-beamer] |
|- | |- | ||
| − | | | + | | Hosted locally || {{Yes}} || {{Yes}} || {{Yes}} || {{Yes}} |
|- | |- | ||
| − | | | + | | Starts on a Raspberry Pi without user interaction || alpha state || {{No}} || {{Yes}} || {{Yes}} |
|- | |- | ||
| − | | | + | | Basic bar charts || {{Yes}} || {{No}} || {{Yes}} || ?/custom |
|- | |- | ||
| − | | | + | | Multi-series bar charts || {{Yes}} || {{No}} || {{Yes}}|| ?/custom |
|- | |- | ||
| − | | | + | | Basic line charts || {{Yes}} || {{Yes}} || {{Yes}} || ?/custom via HTML |
|- | |- | ||
| − | | | + | | Moving average line charts || {{Yes}} || {{No}} || {{Yes}} || ?/custom via HTML |
|- | |- | ||
| − | | | + | | Cropping outliers from charts || {{No}} || {{No}} || {{Yes}} || ?/custom via HTML |
|- | |- | ||
| − | | | + | | Free color choice || {{No}} || {{No}} || {{Yes}} || ?/custom via HTML |
|- | |- | ||
| − | | Displaying live | + | | Displaying binary live data || {{No}} || {{Yes}} || {{Yes}} || ?/custom via HTML |
|- | |- | ||
| − | | Autoswitching between multiple screens || {{No}} || {{No}} || {{Yes}} | + | | Displaying live text messages || {{No}} || {{Yes}} || {{Yes}} || ?/custom via HTML |
| + | |- | ||
| + | | Autoswitching between multiple screens || {{No}} || {{No}} || {{Yes}} || {{Yes}} | ||
|} | |} | ||
The Flutter solution is the most work, because it requires software development rather than just configuration. The idea is to use [https://pub.dev/packages/charts_painter Charts Painter] to write a regular Flutter application that then uses [https://github.com/ardera/flutter-pi flutter-pi] to run on the device (automatically after boot). | The Flutter solution is the most work, because it requires software development rather than just configuration. The idea is to use [https://pub.dev/packages/charts_painter Charts Painter] to write a regular Flutter application that then uses [https://github.com/ardera/flutter-pi flutter-pi] to run on the device (automatically after boot). | ||
| + | |||
| + | Another option for a custom application would be [https://dash.plotly.com/introduction Dash] which does the same thing in Python. | ||
[[User:anlumo|anlumo]] invites everybody else to evaluate other solutions and append another column on the table above! | [[User:anlumo|anlumo]] invites everybody else to evaluate other solutions and append another column on the table above! | ||
Aktuelle Version vom 18. Dezember 2022, 01:56 Uhr
| Language: | English |
|---|
| Dashboard | |

| |
| Gestartet: | |
| Involvierte: | anlumo |
| Status: | in progress |
| Beschreibung: | It's a display showing interesting statistics. |
| Shutdownprozedur: | Integrated into SmartLab |
| Zuletzt aktualisiert: | 2022-12-18 |
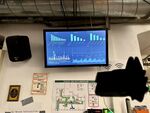
The Dashboard is an art installation in the Otter Space between the server room and the kitchen passage. It currently displays a few interesting stats about the Metalab, mostly concerning the drink sales.
It is currently just a Raspberry Pi 3 running FullPageOS. Its web browser opens a Grafana public dashboard hosted on the SmartLab server.
Version 2
Version 1 is ok, but it has several shortcomings stemming from the fact that Grafana not being designed for this kind of use case (public dashboards). Other solutions should be evaluated.
| Requirement | Grafana | Home Assistant | Flutter | info-beamer |
|---|---|---|---|---|
| Hosted locally | ✔ | ✔ | ✔ | ✔ |
| Starts on a Raspberry Pi without user interaction | alpha state | ✘ | ✔ | ✔ |
| Basic bar charts | ✔ | ✘ | ✔ | ?/custom |
| Multi-series bar charts | ✔ | ✘ | ✔ | ?/custom |
| Basic line charts | ✔ | ✔ | ✔ | ?/custom via HTML |
| Moving average line charts | ✔ | ✘ | ✔ | ?/custom via HTML |
| Cropping outliers from charts | ✘ | ✘ | ✔ | ?/custom via HTML |
| Free color choice | ✘ | ✘ | ✔ | ?/custom via HTML |
| Displaying binary live data | ✘ | ✔ | ✔ | ?/custom via HTML |
| Displaying live text messages | ✘ | ✔ | ✔ | ?/custom via HTML |
| Autoswitching between multiple screens | ✘ | ✘ | ✔ | ✔ |
The Flutter solution is the most work, because it requires software development rather than just configuration. The idea is to use Charts Painter to write a regular Flutter application that then uses flutter-pi to run on the device (automatically after boot).
Another option for a custom application would be Dash which does the same thing in Python.
anlumo invites everybody else to evaluate other solutions and append another column on the table above!